TRENDS IN SPECIES DIVERSITY
Despite the fundamental practical importance of trends in genetic diversity, biodiversity change has mainly been assessed in terms of declining populations and species, either individually, or collectively, when manifest as loss of habitats or reduction in area of ecosystems. Historically, the impetus for much conservation activity has been the drive to prevent the decline and extinction of individual species, with significant emphasis on species that are large and charismatic. The primary benefit of this approach may be that large organisms, terrestrial vertebrates in particular, generally require large areas of suitable habitat, and if such areas can be managed to minimise risk, other species in the system may be safeguarded.
Extinction
There has always been special concern about extinction because of its irreversibility, and the loss of a species will entail loss of unique elements or combinations of diversity at gene and organism level. In this regard, the fossil record demonstrates two important facts. Firstly, that although relative rates have varied greatly, over geological time as a whole there has been a net excess of species originations over species extinctions (i.e. biodiversity has increased). Secondly, that virtually all the species that have ever existed are now extinct, and the extinction of every species is a natural and expected event. Self-evidently there must always have been species at risk of extinction, i.e. `threatened species'.
It is difficult for many reasons to keep track of species extinction in recent time. The species involved may be unknown; it may be unclear whether some population represents a separate species or not; the individuals may be too small to be noticed without special sampling procedures; and the entire process of decline and extinction may extend over much more than an average human lifespan. Positive evidence of extinction (i.e. direct observation of the death of the known last individuals) is unlikely to be available, typically, negative evidence (i.e. failure to find the species despite repeated searches) accumulates to the point where extinction is the most probable explanation.
In other words, unless circumstances are exceptional, monitoring of recent extinction events has a resolution limit measured in decades, and it is thus impossible to state with precision how many species have gone extinct in any given period or to predict exactly how many species are going to become extinct by some point in the future.
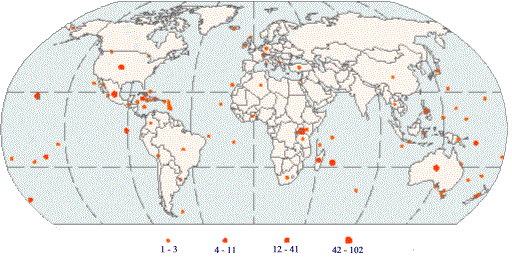
From the imperfect evidence that is available, it appears that around 300-350 vertebrates and nearly 400 invertebrates have become extinct during the past 400 years (see Table 1.4 and Map 3). The number of plant extinctions is thought to be in the hundreds, although some believed to be extinct in the wild have survived in botanic gardens and seed collections. Because mammals and birds tend to be relatively well recorded, and leave recognizable skeletal remains, it is principally among these groups that known extinctions may be reasonably representative of actual extinctions. In these two groups the known rate of extinction over the past 400 years averages around 20-25 species per hundred years.
 |
| Map3. Vertebrates extint since 1600 AD |
The key question then is: how does this compare with the average `normal' extinction rate indicated in the fossil record? Extinction rates have varied greatly, and species that are rare or otherwise prone to extinction must be poorly represented by fossils and so bias the record, but the average lifespan of a fossil species appears to be about four million years. Given this average, if 10 million species existed at any one time, the extinction rate would have been about 2.5 species annually. Applying this factor to recent birds and mammals (numbering about 10,000 and 5000 living species respectively) the expected background extinction rate would be around one species every four hundred years and eight hundred years, respectively. The known recent extinction rate appears to be some 100 or 200 times higher than background. Bias inherent in the fossil record makes it difficult to achieve greater precision in such estimates, but the general direction of the trend is well supported.
4
Because scientific knowledge of the world's species is incomplete and highly vertebrate-centred, it is virtually certain that more extinctions are occurring than currently known. Most predictions of the contemporary extinction rate are based on combining estimates of species richness in tropical forest with estimates of rate of loss of these forests; species extinction is then predicted on the basis of the general species-area relationship, under which species richness will decline as area declines. Projections of this sort suggest the contemporary extinction rate is very high. On a direct numerical basis, most extinctions predicted by calculations based on forest area reduction should involve beetles, because these species make up the great majority of all species in tropical forests. As a cautionary note, it should be observed that very few extinctions have to date been recorded in continental tropical moist forests, although monitoring species in these habitats presents great difficulty.
Most known animal and plant extinctions have occurred on islands, and most known continental extinctions have been among freshwater organisms (most of these being river-endemic molluscs and lake-endemic fishes). From the incomplete information available on the timing of extinction, it appears that the extinction rate (in molluscs, birds and mammals) has risen overall since about 1600 AD to near the middle of the past century (i.e. 1930-1960) and declined thereafter. The apparent decline after mid-century is probably caused in part by the time lag inherent in recording extinction, and in part by the conservation measures that many countries have taken during the latter half of the 20th century. It could also be due to the fact that extinction-prone species in the well-known groups (birds and mammals) have now been lost.
Threatened species
Various national and international programmes have developed methods to assess the relative severity of risks faced by living species, and to label species with an indicative category name. Conservation activities can then be prioritised on the basis of relative risk, taking account of other relevant factors, such as feasibility, cost and benefits, as appropriate. The system developed by IUCN-The World Conservation Union and collaborators in conjunction with its Red Data Book and Red List programme provides a standard at the global level.
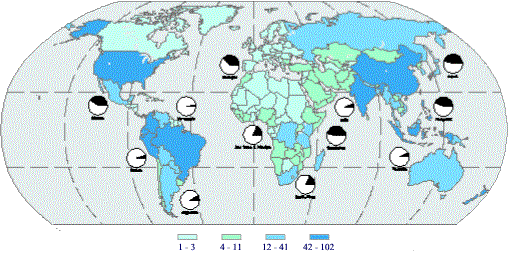
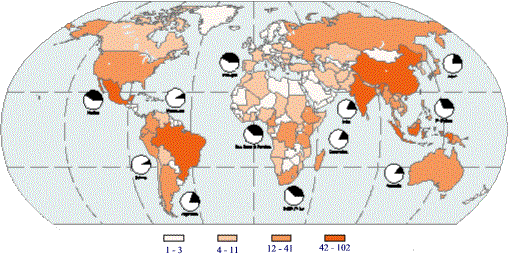
5 To be classified as threatened with extinction, a species is assessed against a set of five quantitative criteria that form the heart of the system. These criteria are based on biological factors related to extinction risk and include: rate of decline, population size, area of geographic distribution, and degree of population and distribution fragmentation. Maps 4 and 5 represent threatened birds and mammals at global and country level.
 |
| Map 4. Threatened birds at global and country level |
 |
| Map 5. Threatened mammals at global and country level |
- Every species will become extinct at some point; virtually all species that have existed are extinct.
- In geological time, origination of species has proceeded at a higher rate than extinction of species, i.e. biodiversity has increased.
- In recent time, the known rate of extinction among mammals and birds is far higher than the estimated average rate through geological time.
- It is possible to estimate the relative risk of extinction among recent species on the basis of demography and distribution.
- All mammals and birds have been assessed for extinction risk: 24% of mammal species and 12% of birds are considered globally threatened in 2000.
In general, small isolated populations will be more sensitive than larger connected ones to demographic factors (for example random events affecting the survival and reproduction of individuals) or environmental factors (for example hurricanes, spread of disease, changes in food availability). Human activities tend to promote fragmentation of natural and often species-rich habitats (for example primary tropical forest or temperate meadow grassland), and the spread of highly managed species-poor habitats (for example teak plantations or cereal croplands). As a result, many species occur in just the kind of fragmented pattern that increases the risk of extinction.
The conservation status of most species is not known in detail, and this certainly applies to the many million as yet undescribed species, but two large animal groups - the mammals and birds - have been comprehensively assessed. Approximately 24% (1130) of the world's mammals and 12% (1183) of the world's bird species are regarded on the basis of IUCN criteria as globally threatened. Proportions are much lower in other vertebrates, but none of these has been assessed fully. Empirical observations such as these give grounds for serious concern for biodiversity maintenance, regardless of any hypotheses that have been proposed regarding the contemporary and future rate of extinction.
Table 1.4
Threatened and extinct species | |
| |
Number of species in group |
Approx. proportion of group assessed |
Threatened species in 2000 |
% of total in group threatened |
Extinct species |
| Vertebrates |
| Mammals |
4763 |
100% |
1130 |
24% |
87 |
| Birds |
9946 |
100% |
1183 |
12% |
131 |
| Reptiles |
7970 |
<15% |
296 |
4% |
22 |
| Amphibians |
4950 |
<15% |
146 |
3% |
5 |
| Fishes |
25 000 |
<10% |
752 |
3% |
92 |
| Invertebrates |
| Insects |
950 000 |
<0.1% |
555 |
0.06% |
73 |
| Molluscs |
70 000 |
<5% |
938 |
1% |
303 |
| Crustaceans |
40 000 |
<5% |
408 |
1% |
9 |
| Others |
>100 000 |
<0.1% |
27 |
0.02% |
4 |
| Plants |
| Mosses |
15 000 |
<1% |
80 |
0.5% |
3 |
| Conifers, cycads, etc |
876 |
72% |
141 |
16% |
1 |
| Flowering plants |
138 000 |
<9% |
5390 |
3.5% |
86 |
Note: The two groups that have been comprehensively assessed (mammals, birds) are shown in bold. The plant data refer to the relatively small number of species that have been assessed using the current IUCN system of threat categorisation; the 1997 plants Red List covered approximately 20% of plant species using the former (pre-1994) IUCN system under which 30,827 taxa (11%) were regarded as threatened. The `Extinct' column includes species believed to have become totally extinct since around 1500 AD, and species extinct in the wild but extant in captivity or cultivation; overall the `extinct in the wild' species form about 6% of the totally numbers shown in this column.
Source: adapted from Table 5.2 in
Global Biodiversity> using revised data from Hilton-Taylor, C (Compiler). 2000.
2000 IUCN Red List of Threatened Species. IUCN, Gland, Switzerland and Cambridge.
4 For further discussion and for sources, see WCMC (2000)
Global Biodiversity: Earth's living resources in the 21st Century(henceforth `
Global Biodiversity'), chapter3. See also
Global Biodiversity Assessment, chapter 4.
5 There are eight categories in the IUCN Red List system: Extinct, Extinct in the Wild, Critically Endangered, Endangered, Vulnerable, Lower Risk, Data Deficient, and Not Evaluated. Species that fall into the categories of Vulnerable, Endangered or Critically Endangered are classified as threatened species. The Red List is produced by the IUCN Species Survival Commission (SSC) - a worldwide network of some 7,000 species experts, and data from a number of partner organisations. So far, countries have not used a standard set of criteria to assess levels of threat to species at country level, with the consequence that it is not straightforward to compare trends in species diversity between countries. It is anticipated that the IUCN/SSC system, used initially at the global level, will increasingly be applied at national level