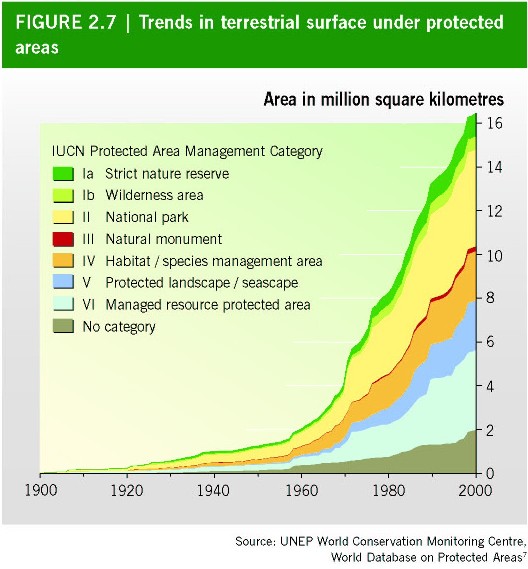
Globally, the number of protected areas has been increasing significantly over the last decade, and there are now more than 100,000 protected sites worldwide covering about 12% of the Earth’s land surface, making them one of the Earth’s most significant land uses . However, while the number and size of protected areas have been increasing, biological diversity loss continues unabated. Figure 1 presents the trends in surface area under protection by IUCN Protected Area Management Categories. About 12% of the area under protection has not been assigned a Protected Area Management Category. Among all categories, National Parks (category II) and Managed Resource Protected Areas (category VI) show a particularly high increase in recent decades.
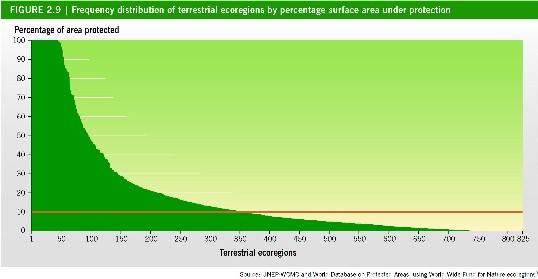
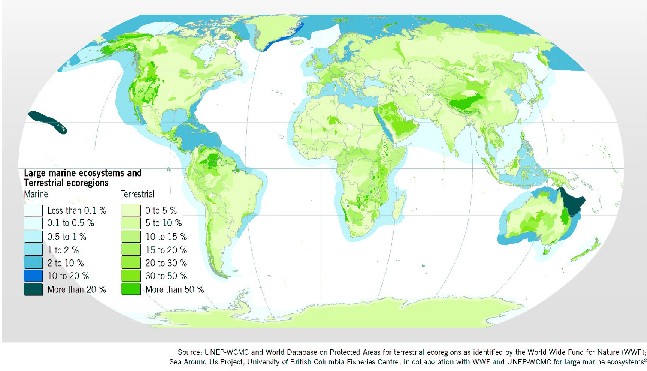
Moreover, there are substantial differences in coverage between different biomes, ecosystems and habitats. Only 5% of the world’s temperate needle-leaf forests and woodlands, 4.4% of temperate grasslands and 2.2% of lake systems are protected. Furthermore, marine coverage lags far behind terrestrial coverage, with approximately 0.6% of the ocean’s surface area and about 1.4% of the coastal shelf areas protected. A more detailed analysis of the 825 terrestrial ecoregions and 64 large marine ecosystems shows that for a large percentage of these ecosystems, which are characterized by distinct populations of species, the target of 10% protected area coverage is yet to be achieved (Figure 2). In Figure 3, terrestrial ecoregions are ordered by percentage under protection. While over 5% of ecoregions are completely protected, in three out of five ecoregions, less than 10% of the surface is protected. In 140 ecoregions, equivalent to 17% of all ecoregions, less than 1% of the surface is designated as a protected area.
Figure 1. Trends in terrestrial surface under protected areas.
Over the last 40 years there has been a paradigm shift in the role of protected areas from “national parks and reserves” to a broader conceptual and practical approach, including sustainable use areas. Currently, it is recognized that protected areas contribute, besides their conservation function, to human welfare, poverty alleviation and sustainable development. The goods and services that protected areas provide include, inter alia, protection of species and genetic diversity; maintenance of ecosystem services, such as watershed and storm protection; carbon sequestration; products for livelihoods of local people (for example, improvement of fishery and forestry yields); and other socioeconomic benefits, such as in relation to tourism and recreation .
Figure 2. Degree of protection of terrestrial ecoregions and large marine ecosystems (all IUCN Protected Area Management Categories combined).
However, many protected areas are ineffective for a number of reasons , including: (i) insufficient financial and technical resources to develop and implement management plans or lack of trained staff; (ii) lack of scientific data and information for management decisions, including information on the impacts of resource use and on the status of biological resources; (iii) lack of public support and unwillingness of users to follow management rules, often because users have not been involved in establishing such rules; (iv) inadequate commitment to enforcing management rules and regulations; (v) unsustainable use of resources occurring within protected areas, including impacts of human settlement, illegal harvesting, unsustainable tourism, and introduced invasive alien species; (vi) contribution to poverty where local people are excluded; (vii) impacts from activities in land and sea areas outside the boundaries of protected areas, including pollution and overexploitation; (viii) poor governance or lack of clear organizational responsibilities for management and absence of coordination between agencies with responsibilities relevant to protected areas; and (ix) conflicting objectives of the protected areas. These issues were discussed at length at the Vth World’s Parks Congress, held in 2003 in Durban, South Africa and reviewed in CBD Technical Series No 15.
Figure 3. Frequency distribution of terrestrial ecoregions by percentage surface area protection.