Chapter 7. Trends in Selected Biomes, Habitats and Ecosystems: Marine and Coastal Habitats
Authors:
Soumitri Das, Corinna Ravilious, and
Lera Miles all UNEP World Conservation Monitoring Centre
Reviewers:
Serbe Andréfouët, Institut de Recherche pour le Développement
Marjo Vierros, United Nations University
Jihyun Lee, Secretariat of the Convention on Biological Diversity
Chandra Giri, SAIC EROS Data Centre
Remote sensing based indicators for marine and coastal habitats
- Extent of coral reef ecosystems
- Percent cover of living coral
- Coral bleaching – direct observation
- Coral bleaching – temperature proxy
- Extent of seagrass ecosystems
- Extent of mangrove ecosystems
- Mangrove habitat conversion (resulting from aquaculture, agriculture, etc.)
- Changes in mangrove extent resulting from natural hazards (e.g., tsunami)
- Change in extent of mangroves, coral or seagrass as a result of regeneration or restoration
- Biomass of mangroves
- Connectivity between mangroves and their associated ecosystems
7.1 Introduction to the Remote Sensing of Coral Reefs, Seagrasses, and Mangroves
Certain marine and coastal habitats can be mapped and/or assessed using remote sensing. These include coral reefs, seagrasses, kelp beds, and mangroves, as well as polar habitats such as sea ice. Remote sensing has more frequently been used in mapping tropical rather than temperate areas as the visibility through the water column is generally better. Long-term threatening processes (such as the development of aquaculture and urbanization in coastal areas, changes in ocean temperature, or river discharge) and short-term threats (such as spreading oil spills or algal blooms) can also be monitored remotely. Some remote sensing programmes also monitor individual marine species, using telemetry (e.g., Blumenthal et al. 2006), or factors controlling their distribution, such as algal blooms (e.g., Burtenshaw et al. 2004).
7.1.1 Coral reefs Coral reefs are among the world’s most diverse and spectacular ecosystems. A coral reef is a “physical structure which has been built up, and continues to grow over decadal time scales, as a result of the accumulation of calcium carbonate laid down by hermatypic corals and other organisms” (Spalding et al. 2001). Reefs can form an integral part of coastal ecosystems, with functional relationships to seagrass beds, sandflats, mangroves, and algal plains. They provide ecosystem goods and services, including protection from tropical storms, reef fisheries, tourism opportunities, building material, and development of new pharmaceuticals (Spalding et al. 2001). The extent of coral reefs can be reduced through physical damage, bleaching, sedimentation, or pollution-induced die-off. Coral reefs and seagrasses (below) generally occur in shallow clear waters, making them amenable to optical remote sensing. Coral reef mapping has been carried out using various satellite and airborne remote sensing methods.
7.1.2 Seagrasses Seagrasses are rooted, underwater marine flowering plants and are not closely related to terrestrial grasses. About 60 species are known, ranging in form from the more-than-4-metre long straplike blades of eelgrass (Zostera caulescens) to tiny, 2–3-centimetre rounded leaves of sea vine (Halophila decipiens). They are an important source of food for dugong, manatee, sea turtle, and waterfowl and provide habitat for many fish and shellfish. In addition, seagrasses filter coastal waters and help to provide stability in near-shore environments by dissipating wave energy and anchoring sediments. Seagrasses often occur in proximity to, and are ecologically linked with, coral reefs, mangroves, salt marshes, bivalve reefs, and other marine habitats (Green and Short 2003). Seagrass beds may be lost as the result of dredging or other physical damage, or pollution.
7.1.3 Mangroves Mangroves are highly productive ecosystems located in intertidal tropical and subtropical regions. They comprise a diverse group of plants (mainly trees and shrubs) that live in salt and brackish waters. They provide habitat for a wide variety of species with a rich genetic diversity. In particular, they act as a nursery ground for many juvenile fish and other marine animals. Mangroves act as buffer zones between terrestrial and marine ecosystems, stabilizing coastlines and river banks, and therefore play an important role in the functioning of adjacent ecosystems, such as salt marshes, seagrass beds, and coral reefs. They are also of great economic importance and often provide valuable ecosystem goods and essential services for local communities (Spalding et al. 1997).

More recently, studies have highlighted the important function of mangrove forests in reducing the impact of natural disasters such as tsunamis and hurricanes. They provide a physical barrier, absorb energy, and reduce erosion (Danielsen et al. 2005; UNEP-WCMC 2006). Reductions in the extent of mangroves usually result from coastal development such as shrimp farming.
7.2 Remote sensing measures of coral reefs and seagrasses
7.2.1 Delineating cover and estimating change in extent Optical remote sensing typically penetrates clear waters to 15- to 30-metre depth (Mumby et al. 2004). Much research has been undertaken into remote sensing techniques for mapping shallow-water ecosystems such as coral reefs and seagrasses. Remote sensing using high-resolution multispectral images is helping to develop baseline maps of the extent, diversity, and condition of coral reefs and seagrasses. A typical coral reef has recognizable zones with different depths and communities: the forereef, reef crest, reef flat, backreef, and lagoon (in barrier reefs and atolls). See figure 7.1. These zones are amenable to optical remote sensing with moderate to high-resolution sensors, because they occur at scales of 10s to 100s of metres (Mumby et al. 2004).
When aiming to distinguish a smaller number of habitat classes (such as corals, algae, sand, and seagrasses), moderate-scale multispectral imagery is often used. The most cost-effective satellite sensors for these purposes are Landsat TM and ETM+), ASTER, and SPOT XS, with a 20–30-metre resolution. (See figure 7.2.) These sensors provide overall accuracies of about 70 percent when atmospheric and water column correction is undertaken in addition to geometric correction, with the accuracy decreasing with the number of classes distinguished (Andréfouët et al. 2003). Mapping is also increasingly being carried out using higher-resolution optical sensors such as IKONOS or QuickBird. There are some trade-offs between the higher spatial resolution and lower spectral resolution; if aiming to distinguish between coral reef communities rather than broader habitat classes, higher spectral resolution appears more important (Mumby et al. 2004).
Acoustic sensors, dragged behind boats, have also been used for habitat mapping and bathymetry to greater depths, but can cover only small areas. Boat-borne laser sensors have also been found useful in distinguishing different communities through their fluorescence spectra, but this technology is still in the research phase (Mumby et al. 2004).
The following guidelines are based on a review of research that targets small selected sites. Adaptations may be required for operational work over larger areas; it is worth consulting an experienced analyst.
Although geometric, atmospheric, and radiometric corrections are routinely carried out for most remote sensing applications, underwater habitat mapping using optical sensors requires an additional water column correction because the depth and colour of water significantly affects the measurements. Green et al. (2000) describe a fairly straightforward correction technique for clear waters observed using imagery with more than two water-penetrating spectral bands (e.g., Landsat TM).
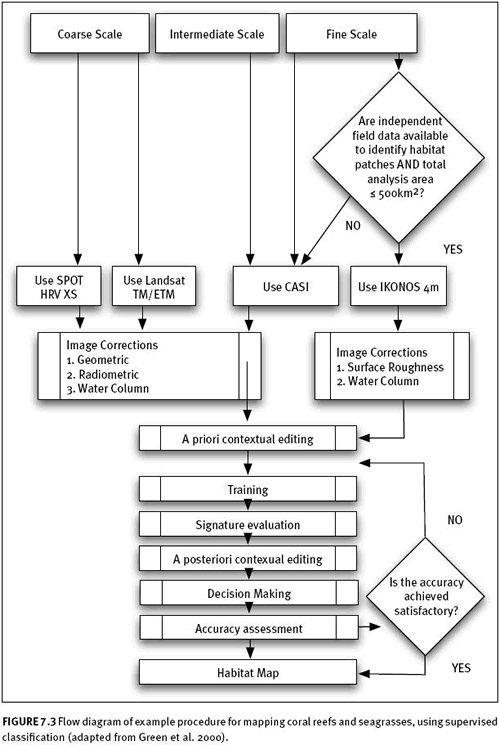
As a first step in producing habitat maps, the analyst is advised to manually segment the image in broad zones of interest to avoid areas of different thematic meaning, but with similar spectral signatures (Andréfouët and Guzman 2005). This is a priori contextual editing: the application of knowledge about where habitats can occur and other knowledge possessed by experts familiar with the area under analysis. Habitat maps can then be produced using supervised multispectral image classification. This method integrates data from field surveys (carried out to define habitat categories, make training sets, and make an independent assessment of map accuracy) and prior knowledge of the interpreter. If necessary, unsupervised classification could also be carried out. Image classification should be followed by a posteriori contextual editing. In this step, misclassified habitats are recoded to the correct habitats: for example, seagrass is occasionally misclassified as coral reef (especially when coral reefs include significant levels of macroalgae), but because seagrass is not found in the forereef, apparent seagrass patches on the forereef can be recoded as coral.
The accuracy of moderate resolution imagery in mapping these marine habitats decreases with increasing habitat complexity. For intermediate and fine-scale habitat mapping, higher-resolution imagery is required. For example, data from digital airborne multispectral instruments such as the Compact Airborne Spectrographic Imager (CASI) can be used to map fine-scale habitat (that includes 13 habitat classes) with an accuracy of about 81 percent (Mumby et al. 1998; Green et al. 2000). The processing required is similar to that required for coarse-level habitat mapping. Although colour aerial photography offers similar levels of accuracy, CASI is more cost-effective. IKONOS 4-metre multispectral imagery has also been tested for habitat mapping (Andréfouët et al. 2003).
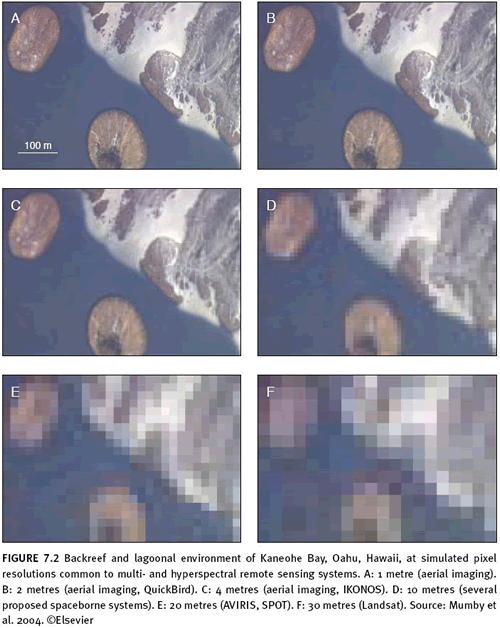
IKONOS 4-metre imagery can be used to map the boundary of habitat patches with greater accuracy than with other satellite sensors, but was less accurate overall than CASI imagery (see table 7.1).
7.2.2 Additional indicators for coral reefs and seagrasses Monitoring of coral reefs and seagrasses is usually undertaken at a local level. To obtain a regional perspective on threats to these ecosystems, these monitoring efforts must be related to adjacent land use. Changes in land use result in changes in sedimentation and pollution patterns, which have direct impacts on coral reefs (Bellwood et al. 2004).
Underwater field survey methods have been used extensively for monitoring coral reefs and seagrasses. Plotless belt transects (using a manta tow technique) enable a wide area to be surveyed at a relatively coarse scale. Change assessments may cover the extent of hard and soft coral, sand, macroalgae, and bleaching. At finer resolutions, more detailed methods, including quadrat surveys, line intercept transects, and video transects are used. Quadrat sampling and linear transects provide a relatively rapid and cost-effective method; however, linear transects tend to underestimate the area of coral cover where it occurs at low density. Data collected via photo-quadrats are useful for site monitoring, but less effective for survey over wide areas because interpretation is time-consuming. Video transects also provide a highly effective sampling method, but incur a high cost in survey and data-processing equipment.
Landsat data time series (Landsat 5 TM and Landsat 7 ETM+) offer a cost-effective resource for large-scale reef surveys and for detecting large changes in coral or seagrass extent over time. TM-ETM+ data normalization may be required to compensate for the difference in relative spectral response between TM and ETM+ (Palandro et al. 2003a). An alternative methodology uses changes in albedo in unclassified TM images to detect loss of coral-dominated area (Dustan et al. 2001).
If the habitat patches have already been mapped, IKONOS data can be used to measure small changes in patch location and boundary (Mumby and Edwards 2002). Palandro et al. (2003b) have demonstrated the potential utility of combining aerial photographs and IKONOS imagery to detect change in coral reef communities.
Coral bleaching, the loss of symbiotic algae in response to stress (such as increased temperature), can be detected remotely because it involves a change in colour. However, very high spatial resolution (less than 1 metre) imagery seems to be required to accurately quantify the extent of bleaching (Andréfouët et al. 2002), with partially bleached corals being particularly hard to identify. Because there are empirical relationships between sea surface temperatures and the likelihood of bleaching, temperature measurements can be used to estimate the strength of bleaching episodes. The NOAA Coral Reef Watch “HotSpot” data set provides a 50-kilometre resolution monitoring of heat stress to coral reefs worldwide, based on Advanced Very High Resolution Radiometer (AVHRR) measurements (Strong et al. 2004). HotSpots are cells that have experienced sea surface temperature more than 1ºC above background levels. Degree heating weeks (DHWs) indicate the accumulation of thermal stress that coral reefs have experienced over the previous 12 weeks.
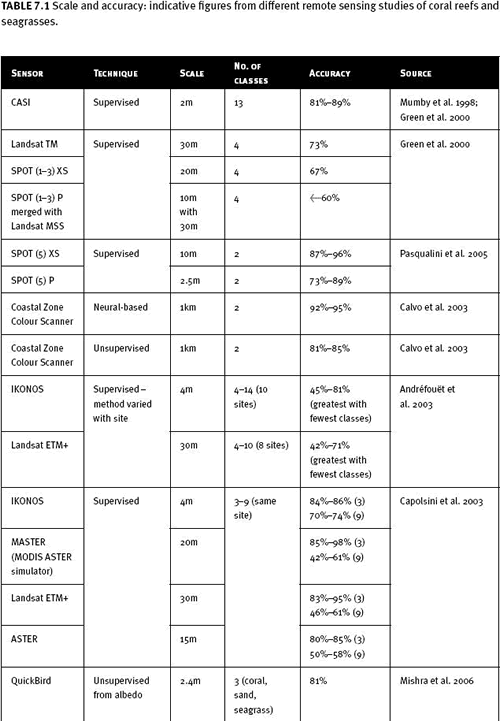
TABLE 7.1 Scale and accuracy: indicative figures from different remote sensing studies of coral reefs and seagrasses.
7.3 Remote sensing measures in mangroves
There are many auxiliary data sets at global, regional, national, and local scales that can be useful to support remote sensing of this ecosystem. Field surveys provide the most important supplementary information in the remote sensing of mangrove ecosystems. The United Nations Environment Programme World Conservation Monitoring Centre (UNEP-WCMC) manages a global mangrove data set compiled from a wide range of sources at scales from 1:10,000 to 1:1,000,000, including processed satellite imagery for some areas. These data may be useful in initial identification of tiles required to map a particular habitat and, in some areas, may assist in ground-truthing imagery analysis. In turn, products derived from remote sensing may be used to update these global data sets to a higher level of detail. High-resolution elevation data sets (e.g., the Shuttle Radar Topography Mission may also be useful for masking out areas that cannot contain mangroves, but the user needs to be aware of their limitations. There is, for example, a known coastline definition problem in SRTM products and their resolution (80 metres feet) is lower than most moderate-resolution satellites. Aerial photographs can also provide supporting information and have extensively been used in the past.
7.3.1 Delineating cover and estimating change in extent Quantifying the true extent of mangroves can be difficult because there is no universal definition. Published statistics may refer to different components of a mangrove ecosystem, ranging from the individual mangrove forest stand through to the entire ecosystem (e.g., including rivers, creeks, and sediments) (Blasco et al. 1998). Hence, categorizing the components of the mangrove ecosystem is essential for undertaking comparative analyses. Techniques for mapping mangroves differ somewhat from those used to map coral reef and seagrass ecosystems. The same standard preprocessing techniques (geometric, atmospheric, and radiometric correction) should be applied, but there is no need to apply a water-column correction because the mangrove canopy is above the water surface. Atmospheric correction is important, particularly in tropical and subtropical coastal areas where air humidity is high (Blasco et al.1998). Remote sensing has been used extensively with a high level of accuracy to discriminate between mangrove and non-mangrove areas. Mangroves can be distinguished by both colour and texture, but in some cases can be confused with other vegetation classes. Some studies have produced more detailed classifications, identifying between two and seven classes of mangrove vegetation (e.g., Green et al. 2000; Giri and Delsol 1995). Common sets of classes include:
Species associations. Stands composed of characteristic species. Dominant species. At present, it is not possible to distinguish all of the ~60 possible mangrove tree species individually. There is some spectral distinction at the generic level (e.g., Rhizophora, Avicennia).
- Tree density (e.g., low, medium, high)
- Percent canopy closure
- Fringing / mixed / shrubby / logged / or cleared mangrove
Contextual editing before image processing is important for masking the image to focus on the area of interest (i.e., excluding water and land areas that are unlikely to contain mangrove). This reduces the effect of surrounding vegetation types in the image processing and thus improves the accuracy of the classification. Field data can be used to guide image classification (e.g., by providing information on location, species composition, and canopy height and density). The sensors most often used in mangrove mapping are Landsat, SPOT, Synthetic Aperture Radar (SAR), CASI, IKONOS, and IRS. Selecting the right band combination helps to enable distinction of mangroves from other classes: for example, typical band combinations for mapping mangroves from Landsat are 543, 431, or 432. A variety of techniques have been used successfully to map mangrove ecosystems. The most appropriate method depends upon scale and the required outputs. For medium-scale mapping, Landsat and SAR data have been used quite extensively. Five main image-processing techniques have been used (Green et al. 2000), all relying upon remote sensing software packages such as ENVI and ERDAS IMAGINE:
- Visual interpretation. A linear contrast stretch is performed, and then the imagery is visually interpreted using other maps and field data.
- Band ratios. The pixels in one image are divided by the corresponding pixels in another (for the same location) to obtain the ratio. These values can then be classified u sing techniques 4 and 5. *Vegetation indices. Such as the normalized difference vegetation index (NDVI), which transform two or more bands into a single index. These values can then be classified using techniques 4 and 5.
- Unsupervised classification. The spectral properties of an image are used to group pixels into classes, with no interference by the user.
- Supervised classification. The spectral properties of an image are used to group pixels into classes, using expert knowledge/field data to control the classification.
Change detection requires comparable data sets to produce useful and accurate results. A high level of accuracy (in both preprocessing and image classification) is particularly important when undertaking change analysis. For example, root mean square (RMS) error in geometric correction should be less than one-half pixel. In change detection analyses, it is preferable that information be derived from the same or similar image sources (e.g., Landsat images from 1990 and 2000) and both processed using a consistent technique.
Some change detection analysis has been undertaken for mangroves. There is no standard methodology for delineating change, but a variety of methods have been used. NDVI can be used to assess change by calculating NDVI for each image date, followed by unsupervised classification of the resultant images. Statistical tests are used to assess those areas that have undergone change (Upanoi and Tripath 2003). Band ratioing (using bands 4/3 and 7/4) has also been used successfully. This has predominantly used multidate Landsat images followed by unsupervised classification to create classes, such as a range from unhealthy to healthy mangrove (Archer et al. 2003). Visual interpretation can be used, but requires greater expert knowledge and user input (Wang et al. 2003). As with mapping distribution, it is useful to obtain field survey data for validation and to improve the accuracy of the classification. For example, in French Guiana, a combination of remote sensing and field surveys was used to assess its dynamic coastline over the past 50 years (where discharges from the Amazon have created a mobile environment of mud banks and mangrove forests). The results of the study showed alternating phases of net accretion (1951–1966 and 1991–present) and net erosion (1966–1991), in which the mangrove forest dynamics were reflected by the growth stages and structure of mangrove forest stands (Fromard et al. 2004). Such integrated analysis of the coastal dynamics and mangrove development has shown how they are closely related. Information such as this could be expanded up to a regional or global context.
7.3.2 Limitations Imagery at very coarse resolutions (e.g., 1-kilometre AVHRR) does not effectively or accurately map mangroves to provide useful information for scientists and resource managers, even at the global scale. Therefore, this can be excluded as a viable information source. Remote sensing becomes a more useful tool at moderate resolutions (e.g., using imagery less than or equal to 30 metres).
Although remote sensing can be used to produce mangrove maps with high levels of accuracy, it is important to be aware of several potential sources of inaccuracy and confusion. Mangroves with a dense canopy may obscure treeless patches and channels, therefore augmenting the actual area of mangroves. Overestimation will be increased in areas of low density or in areas where mangroves grow in small patches. The degree to which this is a problem depends upon whether “mangrove area” is defined as including the entire mangrove ecosystem (including creeks and channels) or purely the individual mangrove stands (Kannan et al. n.d.). Extent may be underestimated where mangroves occur in small patches beyond the spatial resolution of some sensors. This highlights the importance of identifying which components of the ecosystem are to be mapped, selecting the appropriate sensor for the area of interest, and having an awareness of the types of mangrove that are likely to occur there.
Lack of spectral detail in multispectral sensors has caused difficulty in accurately distinguishing mangrove areas from other nonmangrove vegetation. In tropical areas, for example, distinction between mangroves and swamp forest is known to be problematic. SPOT XS, while successful in mapping mangroves in some areas, has been known to require additional inputs from other mapped or image sources in other areas. For example, Green et al. (2000) found that in the Turks and Caicos Islands, mangroves could not be distinguished from adjacent thorn scrub. Multispectral satellite imagery does not accurately distinguish mangroves of differing species compositions (distinguishing only 1–2 classes of dominant species, compared with 8–10 individual species classes obtained by finer resolution hyperspectral sensors such as HYPERION (220-band) and Airborne Visible/Infrared Imaging Spectrometer (AVIRIS) (224-band). For multispectral sensors, a lack of spectral detail can be a limitation, especially when mapping down to the species level. Physiochemical properties of plants (such as chlorophyll content) are linked to spectral responses; therefore, with the broad wavelength bands of multispectral sensors, which cover several tens of nanometres, this information is lost (Vaiphasa et al. 2005). Hyperspectral sensors offer greater potential for mapping density and coverage of mangroves by species (Jupiter et al. 2003), although their effectiveness for tropical mangrove species discrimination has yet to be proven. Vaiphasa et al. (2005) discriminated 16 species with 95 percent confidence, but did highlight difficulty in distinguishing mangrove species in the Rhizophoraceae family.
Cloud cover is often a problem when mapping mangroves using optical sensors. Radar, however, can penetrate clouds and is capable of mapping at moderate and high resolutions (range 8–100 metres) as well as assessing biomass. Early research into mapping mangroves using radar suggests difficulty in achieving high accuracy levels (accuracies ~50 percent); however, limited published research is available (Green et al. 2000; Hashim and Wam Kadir 1999). Combined approaches to enhance resolution of imagery and provide better mangrove delineation can be used. For example, combining radar imagery (e.g., ERS-1 SAR) with optical sensors (e.g., SPOT) has shown high levels of accuracy (84 percent), as well as providing additional information on age of mangrove stands (Aschbacher et al. 1995). However, spectral quality can be reduced (e.g., when applying a resolution merge to a Landsat 15-metre resolution panchromatic band with a 30-metre spectral band). To optimize speed and performance, it is recommended that large amounts of disk space and equipment with high levels of processing power be available for undertaking this type of analysis.
Digital airborne multispectral imagery such as CASI also produces high levels of accuracy. Using supervised classifications, CASI provides greater levels of detail and accuracy than with other optical sensors—and even higher levels using band ratio techniques (Green et al. 2000). However, high-resolution satellite imagery such as QuickBird and IKONOS now challenge this type of sensor. Imagery at 1–4-metre resolution provides highly accurate assessment of mangroves at the species level (Green et al. 2000; Wang et al. 2004). Permanent monitoring at a global scale at such a fine resolution is not practical because of the number of images required for processing, but a repeated sampling scheme could be feasible.
7.3.3 Additional indicators for mangroves Research suggests that mangrove leaf area index (LAI) can be mapped (based on NDVI) using IKONOS sensors. LAI change is related to growth and change in canopy structure. Comparisons of LAI readings obtained in the field with those obtained from remote sensing suggest that this technique could be particularly useful for mapping change in inaccessible areas of mangrove or where field survey is not possible. Although initial investigations have produced significant results, further testing is required (Green et al. 2000; Wang et al. 2004; Kovacs et al. 2004). It may also be possible to use LAI data in modelling expected future growth and in comparing monitored changes in canopy structure resulting from pollution and climate change.
Remote sensing can be used to look at the connectivity between mangroves and their associated ecosystems, in particular in terms of its role in buffering of sediment between marine and terrestrial environments. Remote sensing provides opportunity to evaluate how changes in land use can impact directly upon mangroves and in turn impact upon coral reef and seagrass ecosystems. Few studies to date have used remote sensing to assess this role, but there is great potential for monitoring the impacts of change in terms of mangrove condition (e.g., extent loss and new growth and canopy cover, sedimentation, and hydrology). In this way, remote sensing becomes an increasingly valuable tool for making future predictions, highlighting key areas of threat, and identifying critical sites for restoration and protection (Jupiter et al. 2003).
7.3.4 Scale and accuracy The major advantage of using remote sensing to map mangroves is that many areas, especially the interiors of mangrove regions, are difficult or impossible to access and survey. Monitoring of mangroves using remote sensing is already being undertaken at local and national levels; however, regional- and global-level studies have not yet been carried out. Studies have shown that there is some potential to scale up local and national studies by looking at mangrove zonation patterns alongside associated coastal and ecological processes. These can potentially be used to predict zonation and change at regional levels (Fromard et al. 2004).
Mangrove assessment using remote sensing at local and national levels will eventually need to be placed in a global context to be able to accurately assess the impacts of climate change and sea level rise. Remote sensing could be used in the long-term to monitor ecological processes and predict ecosystem response.
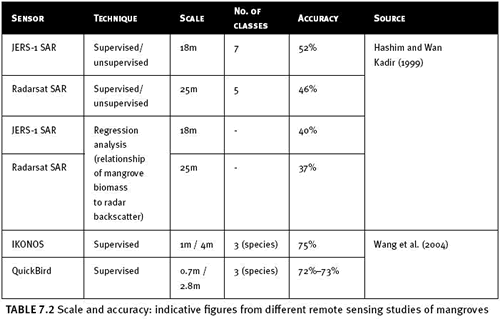
Few published studies for mangrove include an accuracy assessment, which makes it difficult to compare methods used (see Table 7.2 for some exceptions.) Accuracy is dependent upon the resolution of the satellite image, the processing methods used (including the number of classes distinguished), and the availability of field data. Further studies are required that make use of the more recent higher-resolution sensors, with resolutions of 5–10 metres. These may be useful in the further delineation and monitoring of change in mangrove classes at the local level.
To accurately assess change at the national scale, a baseline mapped at a consistent scale using a consistent technique is required. Remote sensing provides a fast, efficient, and valuable tool for fulfilling this need for up-to-date information and the ability to monitor change accurately over time. For example, in Tanzania, remote sensing is used in coastal resource management and ecosystem monitoring (Wang et al. 2003). Mangroves along the Tanzania coast are protected under the Mangrove Management Project (MMP). Landsat imagery has been used, together with field data, to monitor change and the effectiveness of mangrove conservation and sustainable use measures.
To date, analysis of remote sensing data has been undertaken mainly for mangrove inventory and the preparation of distribution maps. A few studies mapped additional information such as tree height or density, but at present these do not provide clear quantitative comparisons between sites. There are no regional- or global-level mangrove assessments mapped from remote sensing, with the exception of the inclusion of a mangrove class in land cover maps such as the 1-kilometre Global Land Cover 2000 data set (Bartholome and Belward 2005).
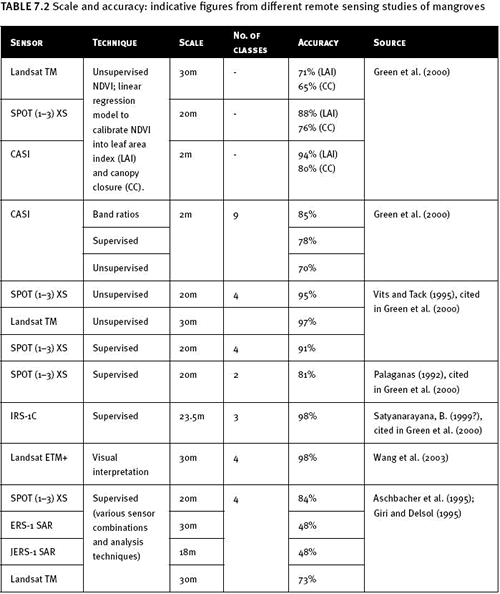
Table 7.2 Scale and accuracy: indicative figures from different remote sensing studies of mangroves
7.4 Data and other resources
Various publications offer guidance on remote sensing analysis within marine and coastal habitats (St Martin 1993, Andréfouët et al. 2002, IGOS 2003). There are also many spatial data sets of coral reefs and seagrasses at global, regional, national, and local scale that can be useful in evaluation or ground-truthing of remote sensing data for these ecosystems. Some global-scale resources are listed below.
ReefBase ReefBase forms an online information system on coral reefs, including downloadable GIS data sets on coral extent, spawning, bleaching, and diseases.
The Millennium Coral Reef Mapping Project and Millenium Coral Reefs Landsat Archive Supported by NASA, the Institute for Marine Remote Sensing at the University of South Florida is developing the first global uniform map of shallow coral reef ecosystems. The Millennium Coral Reef Mapping Project has collated a global compilation of ~1,700 Landsat 7 ETM+ satellite images, with 30-metre spatial resolution (Andréfouët et al. 2006). A thematically rich (966 classes) geomorphological classification scheme was designed and used to interpret and map shallow coral reef systems worldwide. The resulting globally consistent GIS products are expected to be released through ReefBase sometime in 2007. Meanwhile, an archive of Landsat imagery is already available. The Landsat Coral Reef Data Archive displays data that is tiled, zoomable, and downloadable via FTP.
The University of South Florida maintains a site where an index with browse images of all the Landsat 7 data is assembled.
Global Mangrove Database and Information System (GLOMIS) GLOMIS resources, managed by the International Society for Mangrove Ecosystems, include a searchable online reference database of mangrove literature.
NOAA Coral Reef Watch HotSpots Sea surface temperature anomalies, bleaching HotSpot anomalies, Degree Heating Weeks (DHWs), and Tropical Ocean Coral Bleaching Indices are available on an operational basis at the global scale. Introduction:
http://coralreefwatch.noaa.gov/index.html Latest data:
http://www.osdpd.noaa.gov/PSB/EPS/SST/climohot.html
UNEP World Conservation Monitoring Centre UNEP-WCMC hosts a global-scale Geographic Information System (GIS) database of vector and raster data of coral reefs and seagrasses, compiled from a wide range of sources at scales ranging from 1:10,000 to 1:1,000,000, and including processed satellite imagery. The World Atlas of Coral Reefs provides global estimates for coral reefs worldwide and presents reef area estimates for individual countries, supported by maps and statistics for all coral reef nations (Spalding et al. 2001). The World Atlas of Seagrasses contains the first global and regional maps of seagrass distribution (Green and Short 2003). Although these atlases were the first to provide comprehensive data on coral reefs and seagrasses, more detailed data sets are subsequently being developed.
7.5 References
Andréfouët, S., R. Berkelmans, L. Odriozola, T. Done, J. Oliver, and F. Muller-Karger. 2002. Choosing the appropriate spatial resolution for monitoring coral bleaching events using remote sensing. Coral Reefs 21 (2): 147-154.
Andréfouët, S., and H.M. Guzman. 2005. Coral reef distribution, status, and geomorphology-biodiversity relationship in Kuna Yala (San Blas) archipelago, Caribbean Panama. Coral Reefs 24 (1): 31-42.
Andréfouët, S., P. Kramer, D. Torres-Pulliza, K.E. Joyce, E.J. Hochberg, R. Garza-Pérez, P.J. Mumby, B. Riegl, H. Yamano, W.H. White, M. Zubia, J.C. Brock, S.R. Phinn, A. Naseer, B.G. Hatcher, and F.E. Muller-Karger. 2003. Multi-site evaluation of IKONOS data for classification of tropical coral reef environments. Remote Sensing of Environment 88.1-2: 128-143.
Andréfouët, S., F.E. Muller-Karger, J.A. Robinson, C.J. Kranenberg. D. Torres-Pulliza, S.A. Spraggins, and B. Murch. 2004. Global assessment of modern coral reef extent and diversity for regional science and management applications: a view from space. Proceedings of the 10th International Coral Reef Symposium, June 28-July 2, 2004. Japanese Coral Reef Society, Tokyo, Japan.
Archer T.A., J.M. Kovacs, and L.P. Aspden. 2003. Monitoring the decline of a tropical forested wetland of the Teacapán estuarine system, Mexico. Proceedings of the 25th Canadian Symposium on Remote Sensing 2003. Canadian Aeronautics and Space Institute.
Aschbacher, J., P. Tiangco, C.P. Giri, R.S. Ofren, D.R. Paudyal, and Y.K. Ang. 1995. Comparison of different sensors and analysis techniques for tropical mangrove forest mapping. Proceedings of the 16th Asian Conference on Remote Sensing (ACRS), November 20-24, 1995. Suranaree University of Technology, Nakhon Ratchasima, Thailand.
Bartholome, E., and A.S. Belward. 2005. GLC2000: A new approach to global land cover mapping from Earth. International Journal of Remote Sensing 26:1959-1977.
Bellwood, D.R., T.P. Hughes, C. Folke, and M. Nystrom. 2004. Confronting the coral reef crisis. Nature 429 (6994): 827-833.
Blasco, F., T. Gauquelin, M. Rasolofoharinoro, , J. Denis, , M. Aizpuru, and V. Caldairou 1998. Recent advances in mangrove studies using remote sensing data. Marine and Freshwater Research 49: 287–296.
Blumenthal, J.M., J.L. Solomon, C.D. Bell, T.J. Austin, G. Ebanks-Petrie, M.S. Coyne, A.C. Broderick, and B.J. Godley. 2006. Satellite tracking highlights the need for international cooperation in marine turtle management. Endangered Species Research 2: 51-61.
Burtenshaw, J.C., E.M. Oleson, J.A. Hildebrand, M.A. McDonald, R.K. Andrew, B.M. Howe, and J.A. Mercer. 2004. Acoustic and satellite remote sensing of blue whale seasonality and habitat in the Northeast Pacific. Deep Sea Research II 51 (10-11): 967-986.
Calvo, S., G. Ciraolo, and G. La Loggia. 2003. Monitoring Posidonia oceana meadows in a Mediterranean coastal lagoon (Stagnone, Italy) by means of neutral networks and ISODATA classification methods. International Journal of Remote Sensing 24 (13): 2703-2716.
Capolsini, P., S. Andréfouët, C. Rion, and C. Payri. 2003. A comparison of Landsat ETM+, SPOT HRV, Ikonos, ASTER, and airborne MASTER data for coral reef habitat mapping in South Pacific islands. Canadian Journal of Remote Sensing 29 (2):187-200.
Danielsen, F., M.K. Sørensen, M.F. Olwig, V. Selvam, F. Parish, N.D. Burgess, T. Hiraishi, V.M. Karunagaran, M.S. Rasmussen, L.B. Hansen, A. Quarto, and N. Suryadiputra. 2005. The Asian Tsunami: A protective role for coastal vegetation. Science 310 (5748): 643.
Dustan, P., E. Dobson, and G. Nelson. 2001. Landsat Thematic Mapper: Detection of shifts in community composition of coral reefs. Conservation Biology 15.4:892-902.
Fromard, F., C. Vega, C. Proisy. 2004. Half a century of dynamic coastal change affecting mangrove shorelines of French Guiana. A case study based on remote sensing data analyses and field surveys. Marine Geology 208.2-4:265-280.
Giri, C. and J.P. Delsol 1995. Mangrove Forest Cover Mapping Using Remote Sensing Data in Conjunction with GIS. Asian-Pacific Remote Sensing Journal 8.1. ESCAP (Economic and Social Commission for Asia and the Pacific), Bangkok, Thailand.
Green, E.P., and F.T. Short. 2003. World Atlas of Seagrasses. University of California Press, Berkley, 2003.
Green, E.P., P.J. Mumby, A.J. Edwards, and C.D. Clark. 2000. Remote Sensing Handbook for Tropical Coastal Management. Coastal Management Sourcebook 3. Ed. A.J. Edwards.
UNESCO: Paris, 2000.
http://www.unesco.org/csi/pub/source/rs.htm (accessed January, 2007).
Hashim, M., and H.H. Wan Kadir. 1999. Comparison of JERS-1 and RADARSAT synthetic aperture radar data for mapping mangrove and its biomass. 20th Asian Conference on Remote Sensing (ACRS). Hong Kong, China. IGOS 2003. IGOS Coral Reef Subtheme Report. Integrated Global Observing Strategy.
http://www.igospartners.org/docs/theme_reports/IGOS_CoralReefSubtheme.pdf. Accessed 10 May 2007.
Jupiter, S.D., Phinn, S., Duke, N.C., Potts, D.C. 2003. The Buffer Zone: Connectivity Between Mangrove and Coral Reef Ecosystems in the Context of Land Use Change. International Symposium on Remote Sensing of Environment, Honolulu, Hawaii.
http://www.cms.uq.edu.au/mackayarc/publications.htm. Accessed 11 May 2007.
Kannan, L., T. T. Ajith Kumar and A. Duraisamy n.d. Remote Sensing for Mangrove Forest Management.
http://www.gisdevelopment.net/application/environment/wetland/envwm0002.htm. Accessed 11 May 2007.
Kovacs, J.M., F. Flores, J. Wang, and L.P. Aspden. 2004. Estimating leaf area index of a degraded mangrove forest using high spatial resolution satellite imagery. Aquatic Botany 80: 13-22.
Mishra, D., S. Narumalani, D. Rundquist, and M. Lawson. 2006. Benthic habitat mapping in tropical marine environments using QuickBird multispectral data. Photogrammetric Engineering & Remote Sensing 72.9: 1037-1048.
Mumby, P.J., and A.J. Edwards. 2002. Mapping marine environments with IKONOS imagery: enhanced spatial resolution can deliver greater thematic accuracy. Remote Sensing of Environment 82: 248-257.
Mumby, P.J., E.P. Green, and C.D. Clark. 1998. Digital analysis of multispectral airborne imagery of coral reefs. Coral Reefs 17 (1): 59-69.
Mumby, P. J., W. Skirving, A.E. Strong, J.T. Hardy, E.F. Ledrew, E.J. Hochberg, R.P. Stumpf, and L.T. David. 2004. Remote sensing of coral reefs and their physical environment. Marine Pollution Bulletin 48 (3-4): 219-228.
Palandro, D., S. Andréfouët, F.E. Muller-Karger, P. Dustan, C. Hu, and P. Hallock. 2003a. Detection of changes in coral reef communities using Landsat-5 and Landsat-7 ETM+ data. Canadian Journal of Remote Sensing 29 (2): 201-209.
Palandro, D. S. Andréfouët,P. Dustan, F.E. Muller-Karger. 2003b. Change detection in coral reef communities using IKONOS satellite sensor imagery and historic aerial photographs. International Journal of Remote Sensing 24 (4): 873-878.
Pasquilini, V., C. Pergent-Martini, G. Pergent, M. Agreil, G. Skoufas, L Sourbes, and A. Tsirika. 2005. Use of SPOT 5 for mapping seagrasses: An application to Posidonia oceanica. Remote Sensing of Environment 94: 39-45.
Spalding, M.D., C. Ravilious, and E.P. Green. 2001. World Atlas of Coral Reefs. University of California Press, Berkley, 424 pages.
Spalding, M.D., F. Blasco, and C.D. Fields, eds. World Mangrove Atlas. The International Society of Mangrove Ecosystems. Okinawa. Japan, 1997.
St Martin, K. (ed). 1993. Explorations in Geographic Information Systems Technology. Volume 3: Applications in Coastal Zone Research and Management. Clark Labs for Cartographic Information Systems Technology and Analysis, Worcester, Mass. and United Nations Institute for Training and Research (UNITAR), Geneva, Switzerland.
Strong, A.E., G. Liu, J. Meyer, J.C. Hendee, and D. Sasko. 2004. Coral reef watch 2002. Bulletin of Marine Science 75 (2): 259-268.
UNEP-WCMC. 2006. In the front line: Shoreline protection and other ecosystem services from mangroves and coral reefs. Cambridge, UK, 2006, 33 pages.
Upanoi, T. and N.K. Tripath 2003. A Satellite Based Monitoring of Changes in Mangroves in Krabi, Thailand. Map Asia Conference 2003.
http://www.gisdevelopment.net/application/nrm/coastal/mnm/pdf/ma03213.pdf. Accessed 9 May 2007.
Vaiphasa, C., S. Ongsomwang, T. Vaiphasa and A.K. Skidmore 2005. Tropical mangrove species discrimination using hyperspectral data: A laboratory study. Estuarine, Coastal and Shelf Science 65 (1-2):3 71-379.
Wang, Y., G. Bonynge, J. Nugranad, M. Traber, A. Ngusaru, J. Tobey, L. Hale, R. Bowen, and V. Makota. 2004 Remote sensing of mangrove change along the Tanzania coast. Marine Geodesy 26: 1-14.
Wang, L., W.P. Sousa, P. Gong, and G.S. Biging. 2004. Comparison of IKONOS and QuickBird images for mangrove species mapping on the Caribbean coast of Panama. Remote Sensing of the Environment 91: 432-440.